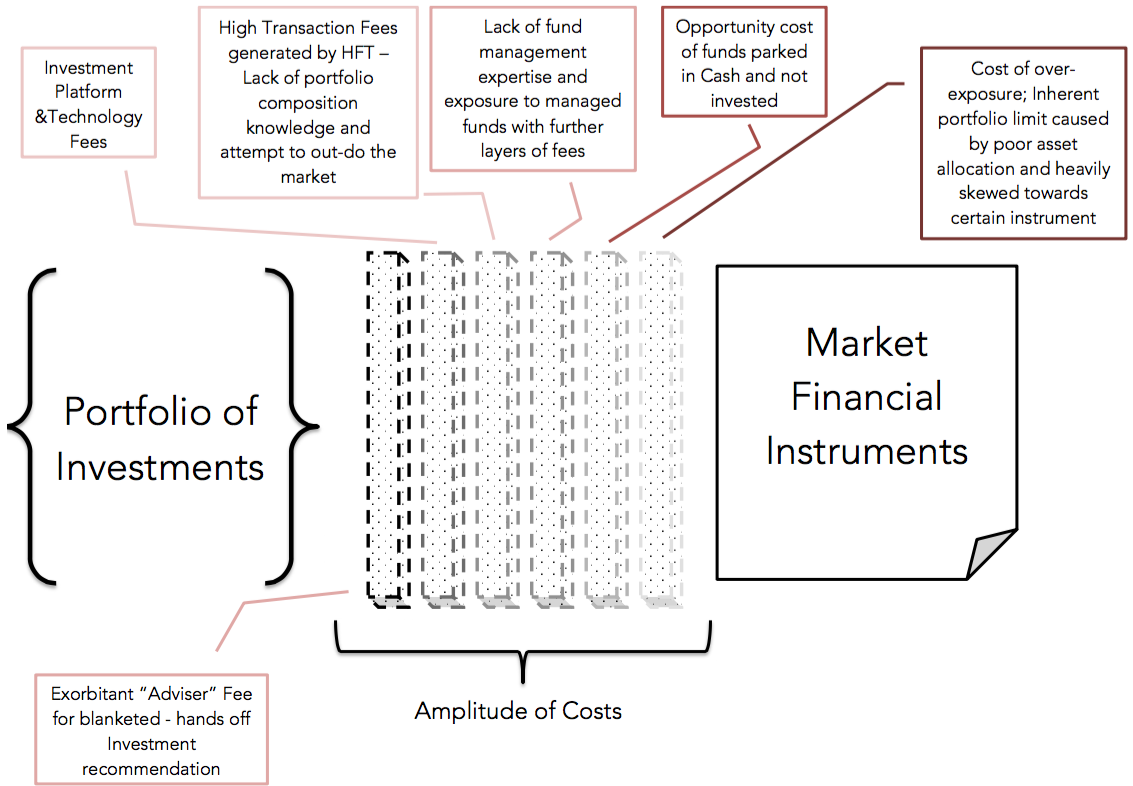
This discussion aims to illuminate portfolio composition costs, the transparency of investment portfolios and how it can affect the performance of investments. The chart below illustrates the layers of investment and platform fees typically found with investment portfolios.
Holding Platform & Cost of Transaction
To the left of the chart is the Portfolio of Investments – which may be a combination of managed funds, direct equities, exchange traded funds (ETFs) or direct investments such as property or even gold bullion. Commonly, the assets apart from direct property are held on an investment or superannuation platform. Shares may also be held directly with brokers without holding costs. There are always transaction costs when buying or selling investments. Capital gains may also be a factor and needs full consideration prior to any investment redemption decisions and hence, Tax planning comes into play.
The second bar to the left of the chart, are investment platform fees. These are unavoidable unless you choose to invest directly and have your assets held personally, on a share trading platform or with share registries. Holding assets directly has is pros and cons. The pro is reduced costs and the con is significantly increased administration burden and additional work for you and your accountant / tax adviser to collate consolidated and comprehensive reports. We use a platform that is very price competitive and comparable to industry superannuation funds in costs.

Elixir Wealth Advisory ©
Advice Fee – Stock Broking
Fees charged by financial advisers which normally ranges from 1.5% – 2% of the investable balance per annum. Our fee is less than this.
The hidden and not often discussed topic – is the portfolio being churned or traded regularly? Transaction costs can eat into your asset base and buy / selling assets frequently only serves the financial interests of market-makers, brokers / agents and some advisers. The composition of an investment portfolio must look at inherent risks, provide sufficient diversification and needs to perform given a set time-frame.
Managed Funds
The third bar to the right of the chart, looks at managed funds with expenses ranging normally between 0.5% to 2.0% per annum. With the advent of Exchange Traded Funds (ETFs) breaking the $20 billion barrier in October 2015 and a preference since the Global Financial Crisis to reduce investment costs, managed funds have suffered huge outflows. Numerous advisers and investors prefer to invest directly (such as via shares and ETFs) and bypassing managed funds all together.
ETFs are basically ASX listed and tradable managed funds and are characteristically passive investments. The majority of managed funds are actively managed but countless research conducted over the past twenty years highlights over the long term (10+ years) that at least 80% of all active fund managers and investors were unable to outperform the market index. Hence, the shift towards passive investing and ETFs.
Cash is trash
The second bar to the right of the chart, highlights what we have seen too many times – funds sitting in cash and not invested due to inertia, oversight or lack of expertise or simply lack of responsibility and care. When inflation (CPI) tracks between 2% to 3% per year and the cash rate is below 2%, funds sitting in cash is losing value as prices and the cost of living increases year-on-year. There are always other options available that can be mated with an investor’s risk and return appetite.
The first bar to the right of the chart, illustrates a layer of potential investment loss built into an adviser’s own pre-disposition towards asset classes and investment style. Too often an investment adviser is favours certain asset classes such as direct property – perhaps they have a financial interest (disclosed or not disclosed) in the transaction – or just has a limited and personal view that a certain asset class will outperform another, sacrificing the diversification of the portfolio in return. Portfolios are designed to be diversified for two main reasons; it reduces risk and it will balance your portfolio’s return over time. This helps you sleep better at night – an important feature to consider.
A research based expertise
Elixir Wealth Advisory’s investment research and wealth advisory team’s mission is to minimise portfolio costs whilst providing a more transparent view to your portfolio with performance in mind. We do this with risk management and an obsessed research focus. We understand that all the research and analysis in the world is never good enough without the end result. That is, your investments need to perform and provide the expected returns. Is it luck, science, experience, insight or art? Perhaps a combination of all.


