Given the volatility of investment markets all around the world since the beginning of 2016, a larger weighting towards defensive assets is a good thing for investors that cannot tolerate investment portfolio price fluctuations. That being said, adjusting your investment portfolio now should not be a decision to be taken lightly as your portfolio should already contain a good balance between your Defensive (cash, fixed interest, etc.) versus Growth (shares, property, etc.) assets that suit your investment style.
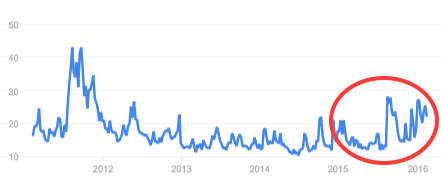
Volatility Index (VIX) Chart 2011 – 2016

The VIX volatility chart above is a known gauge of ‘fear and greed’ in investments. Basically, the higher the value, the higher the level of fear and uncertainty between investors – for professionals with a long term view, this is good time to buy. The lower the value, the more the greed or contentment between investors – a good time to sell. Since the last quarter of 2015 heading into 2016, the VIX values (highlighted) has been increasing. In our opinion and if you have a long term horizon, this is an ideal time to look for opportunities and acquire investments.
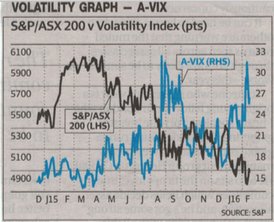
VIX vs ASX200 Chart December 2015 – February 2016

The above chart shows the relationship between VIX (volatility) and the ASX200 index from December 2015 to 19 February 2016. This chart shows a general inverse relationship between the volatility and the ASX200. When share prices were higher (January 2015 to April 2015), there was less volatility and as volatility increased from May 2015 to current (February 2016), the ASX200 share index header lower. As the volatility index is still rather high, there may be further weakness in Australian shares.
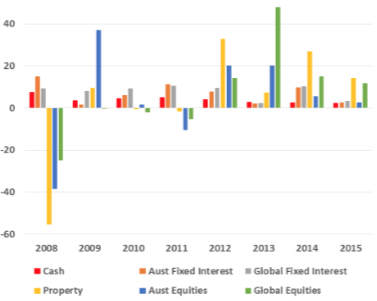
Asset Class Returns & Swings 2008 – 2015

The above chart shows the asset class swings for Cash, Fixed Interest (Term Deposits, Bonds, Treasury Notes, Government & Corporate Debt), Listed & Unlisted Property as well as Shares from 2008 – 2015. As was evident during the Global Financial Crisis (GFC, 2008), Property and Shares were heavily affected. The GFC was the largest financial crisis since the great depression of the 1930s and we (in Australia at least) have not fully recovered from it. A common pattern that can be seen in the above chart is that the prior year’s best performing asset is usually not this year’s best performer. Hence, the asset allocation plus diversification of your investment portfolio is paramount and we suggest that professional advice is sought.
On a purely technical basis, the ASX and most international markets are in bear (negative) return territory. Is there something to be really concerned about? Perhaps only the slowing down of China and the country’s levels of debt is weighing heavily on investors’ minds (psychological). There is talk of a potential second GFC if China’s debt and currency pegging issues blow out.
We must realise that the US and China are the two largest producers of GDP – a common measure of the value of all goods and services produced (financial activity and wealth). China is moving deeper towards a consumption society versus the construction and production orientation of the past. This has relevance to natural resource consumption, especially for exporters of resources such as Australia – sales are down to a large extent. This can be categorised as fundamental factors affecting the economy. There are also oversupplies of oil. Iran (with vast oil reserves) has now re-joined the world economy and the US is the largest producer of oil (taken over Saudi Arabia).
Resource stocks are in heavy bear territory with the outlook on minerals, metals, precious metals, oil, gas and the like not so optimistic for the next few years. It seems technology has played an important part in building efficiencies (car fuel consumption, hybrid & electric cars and Tesla power packs for house that store solar energy as batteries for use during the night as examples), as well as schemes promoting the use of natural resources such as the sun via both commercial and retail solar power as well as wind via commercial turbine power generation.
All being said, if you are investing for the next 10 to +30 years, the current economic and financial issues will literally be insignificant and just a blip on a long term (upwards direction) chart…


